

This applies to the following countries
- All countries
Before you begin
- You need the administrator role in the organisation to see Analytics in the menu.
- The feature is available in the web application.
- No configuration is required — data loads automatically based on your organisation’s activity.
How it works
The dashboard displays several KPI cards that aggregate your organisation’s data in real time:- Expenses per category — Track how spending is distributed across categories (expense, representation, mileage, subsistence allowance).
- Total expense amount per month — Monitor total expense amounts month by month for seamless financial alignment.
- Number of expenses per user — Gain insight into user activity and identify newly onboarded users.
- Active users – trend — Follow how platform usage develops over time.
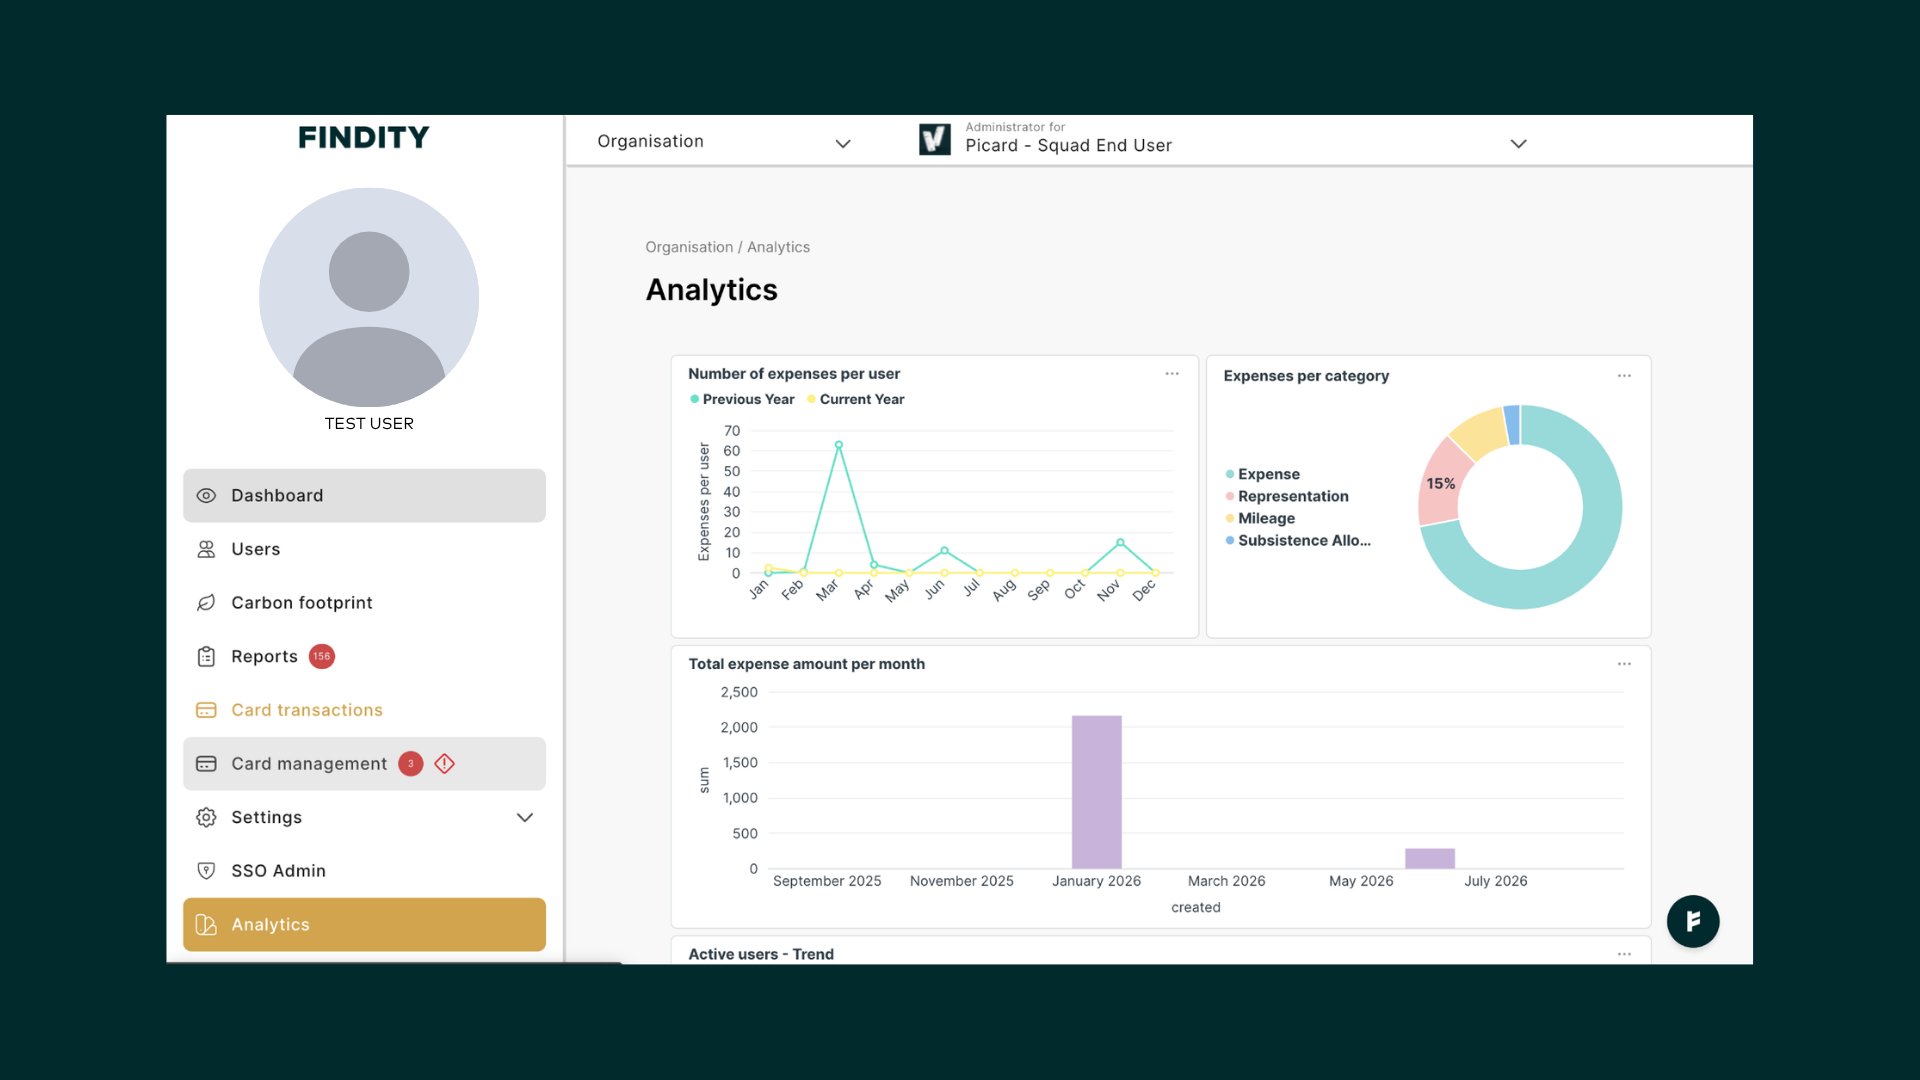
Access Analytics
1
Log in to the web application
Sign in with your administrator account.
2
Open Analytics in the menu
Click Analytics in the left-hand menu.
3
Review the dashboard
Your KPI cards load automatically and are ready for quick review and internal reporting.
Good to know
- Time savings on monthly reporting — Core financial aggregates are available in one central place.
- Enhanced visibility — A quick sanity check on platform usage and spending trends to support internal decision-making.
- No setup required — Insights are ready as soon as you open the section.
- Data updates automatically based on your organisation’s activity.
Next steps
Reconciliation report
Download detailed reports for accounting reconciliation.
Dashboard overview
Understand the columns shown in the dashboard overview.
Frequently asked questions
Who can see Analytics?
Who can see Analytics?
Analytics is visible to users with the administrator role in the organisation.
Do I need to configure anything before using Analytics?
Do I need to configure anything before using Analytics?
No. The dashboard loads automatically with standard KPI cards as soon as you open the section.
Can I export data from Analytics?
Can I export data from Analytics?
Analytics is designed as a quick visual overview. For detailed reporting and export, use the Reconciliation report or other reports in the system.
How often is the data updated?
How often is the data updated?
The data reflects your organisation’s current activity and is updated continuously.